


Use Microblaze performance monitoring engine
Hi,
I would like to use the #MicroBlaze performance monitoring engine to collect some information on my application code running on the processor itself. I would need these information at application level. #Xilinx proposes to collect low-level information by using XSDK "performance view": that is very clear, and it works good, but this type of solution drives to a partial use of the MicroBlaze performance monitoring engine, in the sense that among a large number of events that could be collected, only part of them can be read via XSDK.
To work with others, Xilinx offers the possibility to access to monitoring engine via MicroBlaze Debug Module (MDM): that would be a nice solution for my work.
In order to do these things, I have created a project with MicroBlaze and extended debug function, with 5 event counters and 1 latency counter.
Then I have inserted a MDM in my design and created an AXI4lite slave port to access from MicroBlaze itself. In this mode I should be able to access to internal performance monitoring engine by using DBG_CTRL and DBG_DATA registers indicated to page 12 of pg115 (MDM product guide), with values indicated on page 92 of MB reference guide (version 2015.04).
Suppose I need to measure number of any valid executed instruction, I have wrote the following C code:
    /* some code before */
        unsigned int* dbg_ctrl=(unsigned int*)0x41400010;
    unsigned int* dbg_data=(unsigned int*)0x41400014;
    unsigned int* var_mon=(unsigned int*)0x82000000;
    unsigned int read_value=6;

    init_platform();
    xil_printf ("start \n\r");

    //set first register to be considered
    *dbg_ctrl=0x4a404;
    *dbg_data=1;

    //set event 0 (total instruction executed) to be monitored
    *dbg_ctrl=0x4a207;
    *dbg_data=0;

    //clear the value of all counters
    *dbg_ctrl=0x4a404;
    *dbg_data=16;

    //start monitoring action
    *dbg_ctrl=0x4a404;
    *dbg_data=8;
    //routine to be monitored
    * var_mon=5;
    * var_mon=6;

    //sample the value
    *dbg_ctrl=0x4a404;
    *dbg_data=2;

    //stop the monitoring action
    *dbg_ctrl=0x4a404;
    *dbg_data=4;

    //set first register to be considered
    *dbg_ctrl=0x4a404;
    *dbg_data=1;

    //read the result
    *dbg_ctrl=0x4ac1f;
    read_value=*dbg_data;

    xil_printf ("value is %d \n\r", read_value);

    cleanup_platform();

/*some code after */
The problem happens when I perform the read from *dbg_data: the read action on this variable does not give any response. The register pointed by variable is R/W, so it should work.
Do you have any suggestion about this wrong behaviour?
Thank you.

I think the problem is that you have not declared the memory area pointed to by dbg_ctrl and dbg_data as volatile. That keyword tells the compiler that it cannot 'be clever' about those memory areas ans that the writes and reads that you do have to happen, and have to happen in the order you say.
With what you have now, there's no need for the compiler to perform the read from dbg_data, as it 'knows' taht you just wrote 1 to it (in the section before the read).
In summary, use this:
        volatile unsigned int* dbg_ctrl=(volatile unsigned int*)0x41400010;
	volatile unsigned int* dbg_data=(volatile unsigned int*)0x41400014;
HTH,
Martin
Hi,
thank you for the reply. The problem is not solved by using the volatile keyword.
I can add more information to the post. The following simulation shows actions on *dbg_ctrl and *dbg_data areas (with or without volatile keyword):
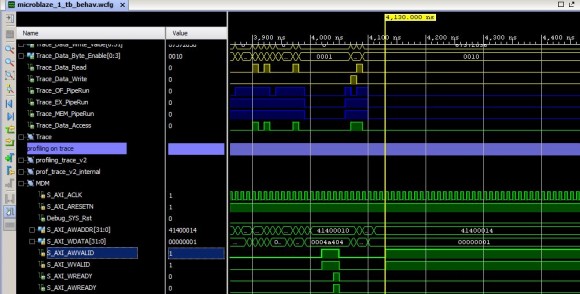
It can be noted that a write in the area 0x41400010 happens, because we can see VALID transitions followed by READY transitions. Then, a write on 0x41400014 does not happen, because after VALID transition there is no READY response. This causes a block in the execution of application, because AXI rules state that after a master raised the VALID signal, it must wait the READY answer from the slave.
So the code execution is blocked at these lines:
    //set first register to be considered
    *dbg_ctrl=0x4a404;
    *dbg_data=1;
Do you have any other suggestion?
Thank you,
Giacomo
Thank you for the answer. Yes I agree with you that the next step should be to understand which are the causes of the "wrong" behaviour of READY signal, in answering to a VALID transition. Indeed the READY signal should come from MDM. The problem is that Xilinx has closed the AXI4Lite slave interface of MDM.
In a general behavioural description of AXI4Lite slave behaviour (sorry for the wordplay), we have:
--some code before
-- axi_awready response
process (S_AXI_ACLK)
    begin
      if rising_edge(S_AXI_ACLK) then
        if S_AXI_ARESETN = '0' then
          axi_awready <= '0';
        else
          if (axi_awready = '0' and S_AXI_AWVALID = '1' and S_AXI_WVALID = '1') then
            -- slave is ready to accept write address when
            -- there is a valid write address and write data
            -- on the write address and data bus. This design
            -- expects no outstanding transactions.
            axi_awready <= '1';
          else
            axi_awready <= '0';
          end if;
        end if;
      end if;
    end process;
--some code after
This piece of code is taken from the Xilinx auto-generated code for AXI4Lite slave peripherals. We met the condition "axi_awready = '0' and S_AXI_AWVALID = '1' and S_AXI_WVALID = '1'", as shown by the timing diagram before. Probably, the AXI4Lite slave from Xilinx has a different behaviour (you can imagine that I contacted Xilinx for this, but they didn't answer to my question...).
Anyway, thank you for the support. If you have other suggestions, please let me know :)
Giacomo
At this stage, I would dig through the logic in the IDE's logic viewer - when I have this sort of problem, it's almost always because I've misunderstood something about how the whole thing is supposed to work, and digging through the logic enlightens me as to what!
(BTW, I agree on the surface it looks to be a problem in the MDM, but past experience has shown me that it's usually not a bug, just that whatever peripheral appears to be misbehaving is actually performing to spec, and I've misunderstood the spec :)
Good luck!
Martin

@adamt99 is the microblaze expert, he might have some input.